Introduction
Underwater sonar mapping is the use of sound waves to measure ocean depths and create detailed maps of the seafloor and submerged structures. It's the backbone of ocean exploration — yet despite decades of use, only 28.7% of the global seafloor has been mapped at high resolution as of April 2026.
Marine scientists, hydrographers, offshore engineers, and infrastructure planners all depend on sonar data. Without it, safe navigation, resource identification, and environmental monitoring are guesswork.
Sonar mapping shows up in ocean exploration news, infrastructure planning, and environmental reports, yet the operational mechanics behind it are seldom unpacked. This guide covers how the process works from signal to map, what degrades accuracy, and where the technology is applied across science, industry, and beyond — including industrial sediment mapping in confined liquid storage environments.
TL;DR
- Sonar maps the seafloor by emitting sound pulses and calculating depth from echo return time
- Three sonar types serve different purposes: single-beam for simple profiling, multibeam for broad high-resolution mapping, side-scan for imaging surface features
- Accuracy depends on water temperature, salinity, vessel motion, and calibration quality
- Applications span navigation safety, scientific research, offshore construction, and environmental monitoring
- As of April 2026, 28.7% of the global seafloor is mapped at high resolution — the Seabed 2030 Project aims for 100% coverage by 2030
What Is Underwater Sonar Mapping?
Sonar mapping is a form of acoustic remote sensing. A transducer emits sound pulses into the water column; they bounce off the seafloor or submerged objects and return as echoes. Depth is calculated from the round-trip travel time multiplied by the speed of sound in water.
Active vs. Passive Sonar
The two terms are frequently confused, but they describe fundamentally different operations:
- Active sonar emits a pulse and listens for the returning echo — this is what bathymetric mapping uses
- Passive sonar only listens for ambient or target-generated sounds — used in military detection and marine mammal monitoring, not mapping
Sonar mapping is exclusively active sonar — without an emitted pulse, there is no depth data to collect.
Three Related but Distinct Technologies
People frequently group these together, but they serve different purposes:
| Technology | What It Measures | Primary Output |
|---|---|---|
| Bathymetric sonar | Water depth | Terrain elevation grids |
| Side-scan sonar | Seafloor texture/features | Acoustic shadow images |
| Sub-bottom profiling | Sediment layers below the seafloor | Stratigraphic cross-sections |
A complete seafloor characterization survey typically deploys all three.
How Underwater Sonar Mapping Works
Sound travels through seawater at approximately 1,500 meters per second. That figure shifts with temperature, salinity, and pressure. The depth formula is straightforward: Distance = (Speed × Time) / 2. The division by two accounts for the round trip.
The challenge is that speed isn't constant throughout the water column. Sonar beams refract — they bend — as they pass through layers with different sound speeds. If that variability isn't measured and corrected for in real time, depth readings will be wrong. This is why sound velocity profiles (SVPs), collected using CTD instruments or moving vessel profilers, are a required input for any survey that needs accurate depth readings.
Here's how those physical properties play out across the full survey cycle.
Step 1: Sound Transmission
A sonar transducer converts electrical energy into directional sound pulses. In multibeam systems, a fan of dozens to hundreds of beams fires simultaneously across a wide swath, covering several times the water depth in a single pass. Single-beam systems emit one pulse directly downward per ping.
Step 2: Signal Reception and Timing
A hydrophone array records the returning echoes. The system logs the precise two-way travel time for each beam. The amplitude of each return — called backscatter — provides additional information about seafloor composition: hard rock returns strong signals, soft sediment returns weaker ones.
Step 3: Data Processing and Map Generation
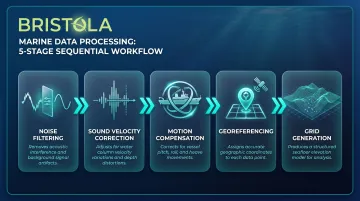
Raw echo data goes through several processing stages before becoming a usable map:
- Noise filtering — removing false returns from fish, bubbles, or electronic interference
- Sound velocity correction — applying SVP data to correct for beam refraction
- Motion compensation — correcting for vessel pitch, roll, and heave using inertial measurement units
- Georeferencing — assigning GPS coordinates to each depth measurement
- Grid generation — compiling thousands of depth points per second into a Digital Elevation Model (DEM) or bathymetric grid
The final output is a numerical depth grid, not a photograph. The vivid seafloor images seen in documentaries are false-color visualizations of that grid data.
Types of Sonar Systems Used in Ocean Exploration
Single-Beam Sonar
The simplest form: one pulse, one depth measurement, directly below the vessel. Single-beam systems (sometimes called fathometers) are practical for port surveys, river channels, and spot soundings where broad coverage isn't required. They can't efficiently map large areas because each pass covers only a single line of depth points.
Multibeam Sonar
Multibeam echo sounders dominate seafloor mapping because of one key advantage: coverage. They emit a fan of beams that typically spans a swath 2–4 times the water depth in a single pass — meaning a vessel surveying in 1,000 m of water can map a corridor up to 4,000 m wide simultaneously.
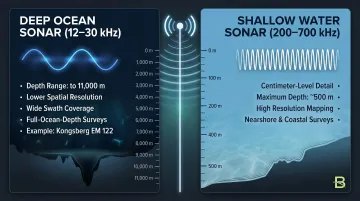
Frequency determines the trade-off between depth range and resolution:
- Deep ocean (12–30 kHz): Penetrates to 11,000 m but with lower resolution — the Kongsberg EM 122 at 12 kHz is a standard example for full-ocean-depth surveys
- Shallow water (200–700 kHz): Delivers centimeter-level detail but only works in water typically shallower than 500 m
That gap — deep range vs. fine detail — is exactly where side-scan sonar fills in.
Side-Scan Sonar
Rather than pointing straight down, side-scan systems are towed behind a vessel and emit beams at an angle to each side. The result is an acoustic shadow image of the seafloor surface — like a radar image — that reveals texture, relief, and objects.
Side-scan is the preferred method for:
- Locating shipwrecks and debris fields
- Detecting pipelines, cables, and anchors
- Habitat characterization
- Pre-construction hazard surveys
It does not produce depth measurements on its own. For complete seafloor data, side-scan is typically paired with multibeam.
Key Applications of Sonar Mapping in Ocean Exploration
Scientific Research
Multibeam surveys have produced discoveries that fundamentally changed our understanding of the planet's geology and biology:
- The mid-ocean ridge system — Earth's longest mountain range at roughly 40,000 miles, over 90% of it underwater — was mapped through decades of multibeam surveys
- Challenger Deep's most precise depth measurement, 10,935 m ±6 m, came from 2020 submersible transects published in Deep Sea Research I (2021); an earlier 2011 multibeam survey reported 10,994 m ±40 m, illustrating how method choice affects precision
- A synthesis of 31 multibeam surveys revealed a 6.4-million-acre field of cold-water coral mounds on the Blake Plateau off the southeastern US — the largest known deep-sea coral reef habitat identified to date
Engineering and Infrastructure
Sonar data sits directly in the decision chain for offshore construction. The US Bureau of Ocean Energy Management (BOEM) requires 100% multibeam coverage, overlapping side-scan, and sub-bottom profiling for offshore wind site assessments. Before a single piece of hardware goes in the water, detailed sonar surveys cover:
- Submarine cable routes
- Pipeline corridors
- Drilling platform sites
Beyond the Ocean
The same acoustic sensing principles used in ocean mapping also apply wherever human entry is impractical — including industrial liquid storage. Bristola, a Des Moines-based industrial services company, uses sonar technology paired with GPS positioning to measure sludge accumulation on the bottom of non-covered ponds and lagoons. The output is a 3D rendering that shows sediment volumes, average depths, and settlement variation across the facility floor.
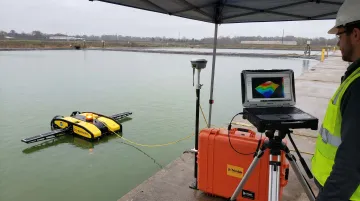
Their ROV cleaning system takes this further — sonar navigation guides the robot inside tanks where optical visibility is zero, making remote operation possible in conditions no human could safely enter.
Factors That Affect Sonar Mapping Accuracy
Water Column Variability
Sound speed changes with depth as temperature, salinity, and pressure vary. Those changes cause sonar beams to bend along curved paths rather than straight lines. Without frequent sound velocity profile (SVP) measurements and ray-tracing corrections applied during processing, the apparent seafloor position shifts away from the real one, sometimes by tens of meters at oblique beam angles in deep water.
Vessel Dynamics
Environmental factors like water column variability are only part of the challenge. Vessel-related error sources compound each other just as significantly:
- Pitch and roll in rough seas shift beam pointing angles, displacing where depth is assigned on the seafloor
- Lever arm offset (the distance between the sonar transducer and the GPS antenna) must be precisely measured; any error propagates through every sounding
- Speed over ground affects swath geometry and line spacing
At greater depths, these errors multiply fast. A 1-degree beam angle error at 5,000 m depth translates to roughly 87 m of horizontal position error.
Where Sonar Fails
Sonar is not universally applicable. Mapping accuracy degrades or fails in these conditions:
- Aerated or bubbly water: bubbles scatter sound signals before they reach the seafloor
- Severe turbulence: strong sea states degrade bottom detection, particularly with towed systems
- Very shallow, high-complexity environments: dense aquatic vegetation or complex biogenic cover produces ambiguous backscatter
- Centimeter-level resolution at great depth: surface ship multibeam cannot achieve this; deploying an AUV closer to the seafloor is required
The Future of Underwater Sonar Mapping
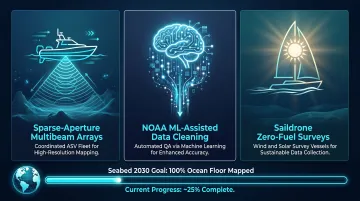
The Seabed 2030 Project — a joint initiative by the Nippon Foundation and GEBCO — is the most ambitious global mapping effort underway. As of April 2026, 28.7% of the seafloor is mapped at high resolution, with nearly 5 million km² added in the most recent year alone. The target: 100% global coverage by 2030.
Getting there requires technology that can map more area at lower cost. Three developments are driving progress:
- Coordinated ASV fleets: MIT Lincoln Laboratory is developing a sparse-aperture multibeam system using small autonomous surface vehicles to synthesize a large sonar array, achieving AUV-quality resolution from the surface at a fraction of the deployment cost
- Automated QA via machine learning: NOAA is piloting tools that detect targets in multibeam data and accelerate the cleaning and quality-assurance steps that previously demanded extensive manual review
- Wind- and solar-powered survey vessels: Saildrone USVs complete full-ocean-depth multibeam surveys without fuel costs or crew, cutting both emissions and operational overhead compared to traditional research ships
Together, crowdsourced bathymetry from commercial shipping, autonomous platforms, and AI-driven processing are compressing what would have been a decades-long mapping backlog into a realistic four-year sprint to full global coverage.
Frequently Asked Questions
What is sonar mapping of the sea floor?
Seafloor sonar mapping (bathymetric mapping) uses acoustic pulses to measure water depth across large areas and build topographic models of the ocean floor. Depth is calculated by timing how long a sound pulse takes to travel from the transducer to the seafloor and back, then dividing by two and multiplying by the speed of sound.
How does sonar technology work?
A transducer emits a directed sound pulse into the water. When it strikes the seafloor or an object, it reflects back to the vessel's hydrophone array. The system calculates distance from the two-way travel time multiplied by the speed of sound — roughly 1,500 m/s in seawater, adjusted for actual water column conditions.
Do ships still use sonar?
Yes, extensively. Modern vessels use sonar for navigation safety, seafloor mapping, fisheries research, and scientific surveys. Hull-mounted multibeam systems have largely replaced early single-beam fathometers on survey vessels, and AUV-deployed sonar systems extend coverage to areas too deep or complex for surface ships alone.
What did sonar mapping reveal about the ocean floor?
Major discoveries include the full extent of the mid-ocean ridge system, the precise depth of Challenger Deep (10,935 m ±6 m), the 6.4-million-acre Blake Plateau cold-water coral reef system, and numerous unmapped seamounts that posed uncharted navigation hazards.
What is the difference between active and passive sonar?
Active sonar emits a sound pulse and measures the returning echo to determine range and target characteristics — this is what all mapping systems use. Passive sonar only listens for sounds generated by other sources, such as marine animals, vessels, or geological activity, and cannot independently measure distance.
What percentage of the ocean floor has been mapped?
As of April 2026, 28.7% of the global seafloor has been mapped at high resolution, per NOAA and the Seabed 2030 Project. The initiative targets complete global coverage by 2030, with crowdsourced data, autonomous platforms, and international partnerships accelerating progress.