Most operators know the headline numbers. Fewer understand what actually drives performance away from those numbers in day-to-day operation — or what the downstream consequences look like when a clarifier quietly underperforms for months before anyone notices.
This article covers what TSS and BOD removal efficiency actually represent, the verified efficiency ranges from WEF and EPA sources, the variables that push real-world performance away from design targets, and how to detect degradation before secondary systems absorb the cost.
TL;DR
- Primary clarifiers typically remove 95–99% of settleable solids, 50–65% of TSS, and 25–40% of total BOD₅ under standard operating conditions
- BOD removal is structurally limited by the soluble fraction — dissolved BOD passes through the clarifier untreated regardless of settling performance
- Hydraulic overload, sludge blanket buildup, cold temperatures, and industrial influent characteristics are the main drivers of efficiency decline
- Sludge accumulation reduces effective tank volume and compresses hydraulic detention time, making it one of the most overlooked drivers of long-term performance loss
- Taking a clarifier offline to clear sludge buildup creates bypass risk — maintaining volume without shutdown is the lower-risk operational approach
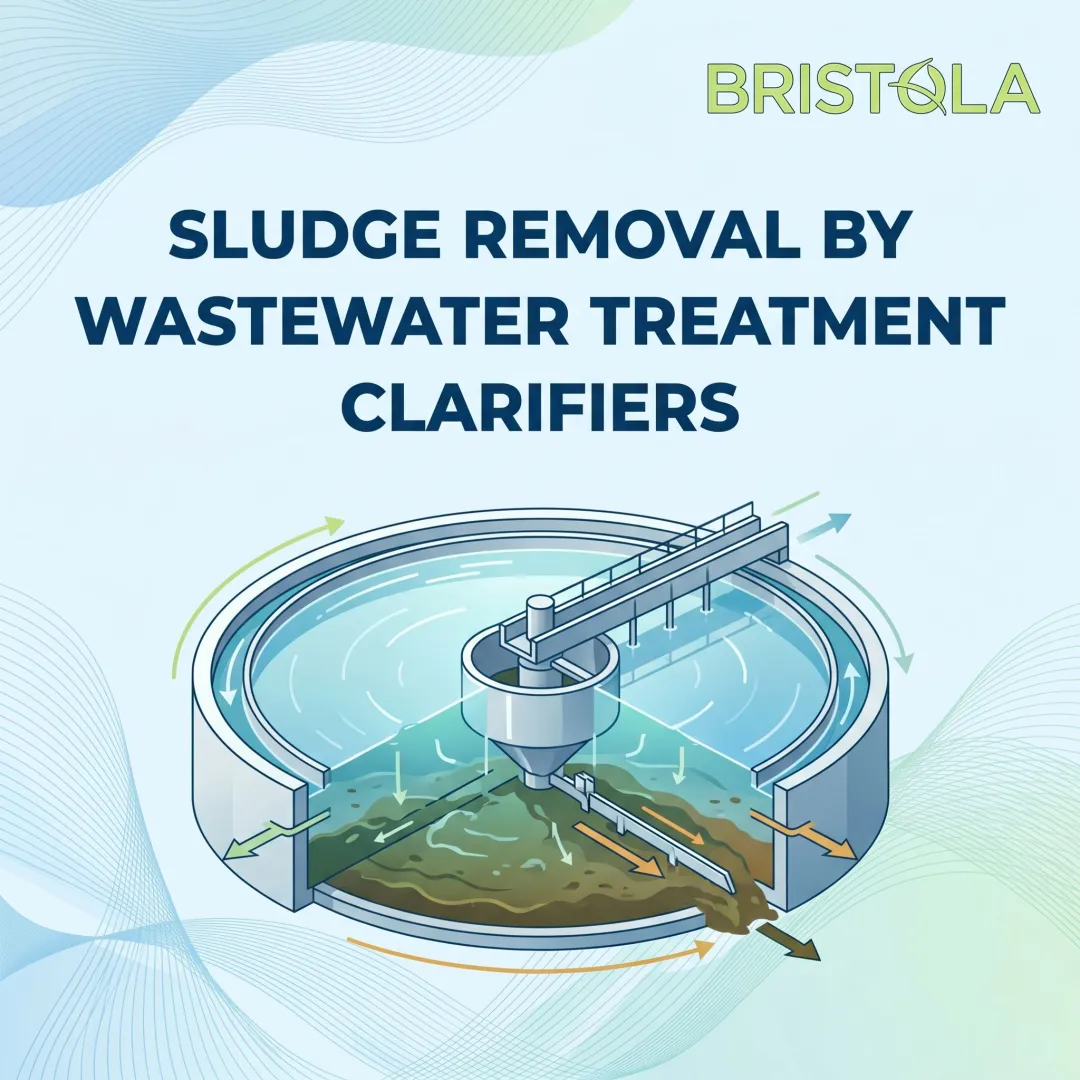
What TSS and BOD Removal Efficiency Mean in Primary Treatment
Two Metrics, Different Ceilings
TSS removal efficiency measures the fraction of particulate solids removed from the water column — straightforward gravimetric reduction. BOD removal efficiency measures something different: the reduction in total oxygen demand achieved by physical separation alone, across both particulate and soluble fractions combined.
That distinction matters because primary treatment is a physical process, not a biological one. Removal occurs through gravity settling and surface skimming, not microbial degradation — and nothing in a conventional primary clarifier is designed to break down dissolved organic matter.
This limits the maximum achievable BOD reduction in a way that is structural, not operational.
Three Solid Fractions, Three Behaviors
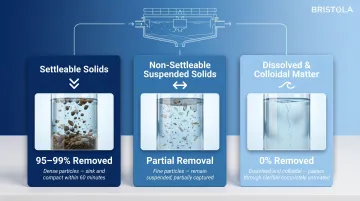
Understanding clarifier performance requires distinguishing between three particle populations:
- Settleable solids — dense particles that sink under gravity within approximately 60 minutes; the primary clarifier captures these most effectively
- Non-settleable suspended solids — fine, light particles that remain in suspension beyond the clarifier's hydraulic retention time
- Dissolved and colloidal matter — fully dissolved organics that no conventional clarifier can remove by settling
TSS includes both settleable and non-settleable particles. That's why TSS removal (50–65%) is always lower than settleable solids removal (95–99%) — the fine particle population doesn't cooperate with gravity on the same timeline.
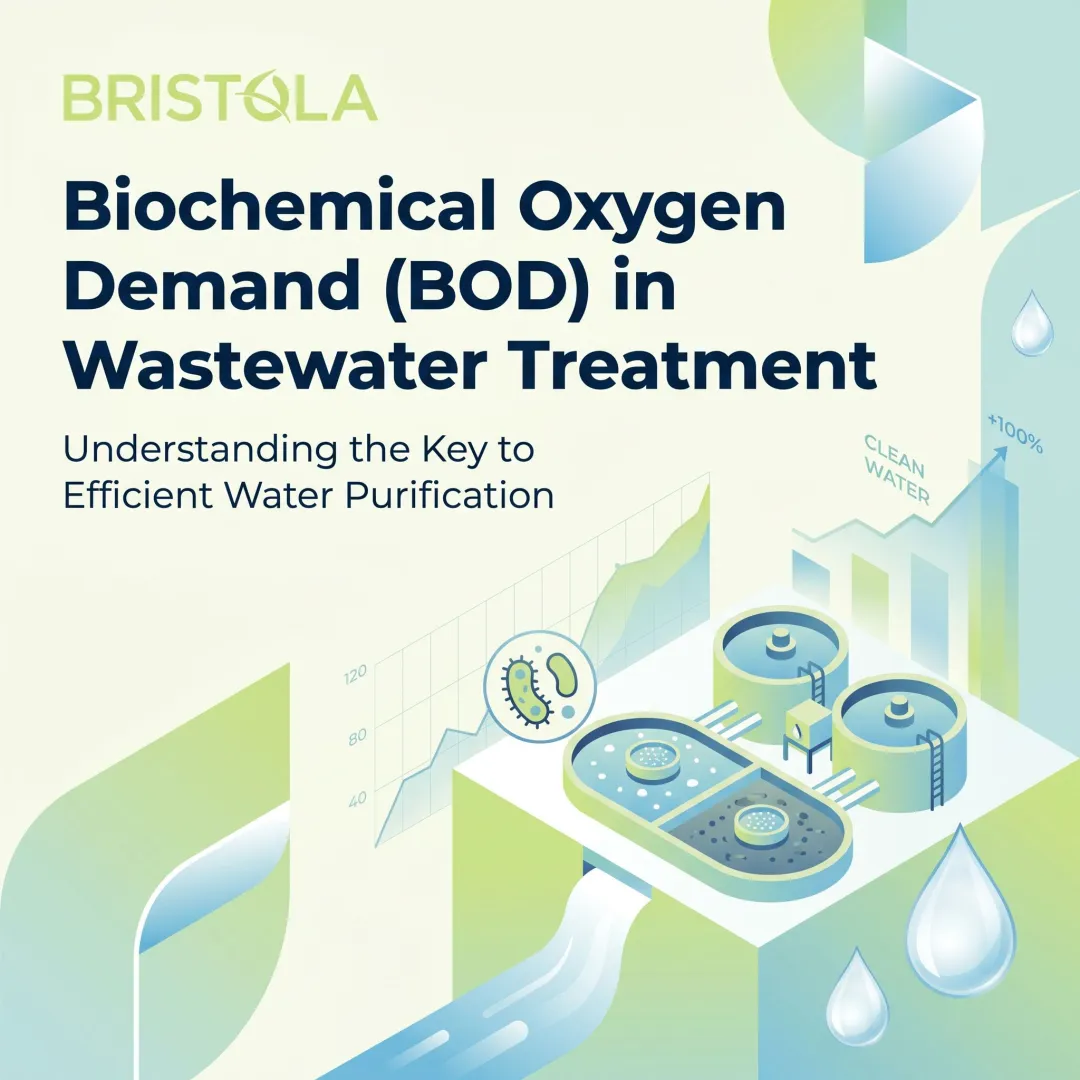
Why BOD Has a Lower Ceiling
BOD in raw wastewater exists in two forms: particulate BOD, which is associated with suspended solids and physically removable through sedimentation, and soluble BOD, which is dissolved in the water fraction and passes through the clarifier regardless of how well solids are captured.
Ohio WEA data on COD fractions shows that readily biodegradable COD (rbCOD) represents 8–25% of total COD in raw municipal wastewater, with slowly biodegradable COD making up 50–77%. After primary settling, the soluble fraction actually concentrates slightly because particulate matter has been preferentially removed. The soluble BOD that remains is what secondary biological treatment must handle — primary treatment cannot touch it.
Primary clarifiers sit between screening/grit removal and secondary biological treatment, and their function is load reduction — not final effluent quality. That fractionation data explains why: a clarifier optimized for solids capture will still pass the bulk of soluble BOD downstream to biological treatment. Performance targets need to reflect what the unit process is actually designed to do.
Expected Removal Efficiency Ranges in Primary Clarifiers
Published efficiency ranges reflect standard design assumptions: hydraulic detention times of 1.5–2.5 hours, surface overflow rates within design bounds, and representative domestic influent. Any deviation shifts performance.
Settleable Solids Removal
WEF Operator Essentials (2018) documents settleable solids removal at 95–99% in properly operating primary clarifiers. These particles are dense enough to settle within the available hydraulic detention time without chemical assistance — which is why this metric serves as the most reliable indicator of basic clarifier health.
Settleable solids, however, represent only a portion of total TSS. High settleable solids removal does not guarantee high overall TSS removal if the influent carries a significant fine particle load.
Total Suspended Solids (TSS) Removal
Standard TSS removal ranges from 50–65% under typical operating conditions, per WEF (2018) and EPA's 2023 operator guidance. The gap between settleable and total TSS removal reflects the non-settleable fine particle population.
TSS removal can be pushed toward or beyond the upper boundary through:
- Lamella plate modules expand effective settling area by 2–10x, pushing TSS removal to 90–95%
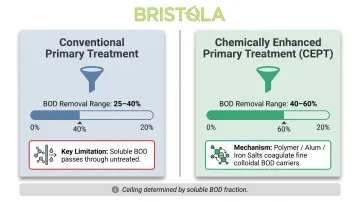
- Chemical coagulation/flocculation (polymer, alum, iron salts) — used in chemically enhanced primary treatment (CEPT) — brings TSS removal to 60–90%
- Reducing the hydraulic loading rate extends settling time and improves particle capture across the board
BOD Removal
Standard BOD₅ removal ranges from 25–40% in conventional primary clarifiers. That ceiling is lower than TSS removal because sedimentation cannot capture soluble BOD — only particulate-bound BOD settles out.
Adding polymer, alum, or iron salts shifts that range considerably. CEPT pushes BOD removal to 40–60% by coagulating fine colloidal particles that carry associated BOD. For plants needing to protect overloaded secondary systems, CEPT is the most direct available lever.
Even without chemical addition, a well-maintained primary clarifier offloads measurable BOD load from downstream biological processes. Optimizing primary performance is typically the lowest-cost path to extending secondary system capacity.
Variables That Drive Efficiency Deviation in Real-World Operation
Primary clarifiers are designed around theoretical hydraulic parameters. Real-world conditions — flow variability, influent composition shifts, equipment condition, temperature, and maintenance history — regularly push actual performance away from published ranges.
Hydraulic Detention Time and Overflow Rate
Hydraulic detention time (HDT) is the most directly controllable efficiency variable. At average flow, design surface overflow rates (SOR) of 800–1,200 gpd/ft² (32–49 m³/m²/day) maintain expected TSS removal. When influent is co-settled with waste activated sludge, WEF guidance requires reducing average SOR to 600–800 gpd/ft² because biological floc settles more slowly than raw primary solids.
The peak SOR limit of 3,000 gpd/ft² (122 m³/m²/day) represents the threshold beyond which settling performance degrades significantly. Above this rate, particles simply don't have enough time to reach the floor before being carried over the effluent weir.
Weir overflow rate limits add a second hydraulic constraint: 20,000 gal/ft/day for facilities under 1 MGD; 30,000 gal/ft/day for larger plants.
Influent Characteristics and Waste Stream Variability
Industrial influent streams differ fundamentally from domestic municipal flows. Dairy wastewater carries BOD₅ of 240–5,900 mg/L with high soluble fractions driven by lactose — a sugar that dissolves completely and cannot be settled out. Food processing streams present similar challenges, often with high FOG content that forms floating mats interfering with skimmer operation.
The result: a primary clarifier receiving dairy or food processing influent may achieve BOD removal well below 25% even when hydraulic conditions are correct, because the soluble fraction dominates.
There's also the phenomenon termed "phantom BOD" — insoluble solids that escape primary clarification settle in downstream aerated basins, gradually degrading into soluble BOD that creates unexpected oxygen demand. This delayed oxygen demand doesn't appear in the influent BOD₅ measurement and EBS BioWizard's analysis documents it as a documented problem in pulp and paper applications, where fibrous solids degrade slowly enough that standard 5-day BOD tests underestimate their total oxygen demand.
Sludge Blanket Depth and Accumulated Solids
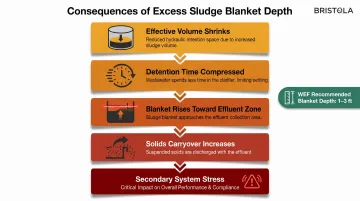
WEF guidance identifies 1–3 feet as the ideal sludge blanket depth. When accumulated sludge exceeds that range, the consequences compound:
- Effective clear water zone depth shrinks, compressing hydraulic detention time
- The sludge blanket rises toward the effluent zone, increasing solids carryover risk
- High torque on collector mechanisms can break shear pins, stopping the scraper entirely
- Gas bubble formation on the tank surface signals anaerobic conditions in the blanket
These consequences accumulate gradually — rarely triggering an alarm until secondary systems show visible stress, which makes excess sludge blanket depth one of the most underestimated performance risks in daily operation.
Traditional corrective action creates a catch-22: taking a primary clarifier offline to drain and clean it produces the very bypass condition that poor performance was making more likely. Bristola's submersible ROV system addresses this directly. Using a patented equalization chamber entry system, it removes accumulated sludge while the tank remains in full service — no shutdown, no drainage, no lost effective volume.
Temperature Effects
Per Stokes' Law, settling velocity is inversely proportional to fluid viscosity. Water viscosity increases substantially as temperature drops:
| Temperature | Dynamic Viscosity | Relative Settling Velocity |
|---|---|---|
| 5°C | ~1.52 cP | ~34% slower than baseline |
| 10°C | 1.31 cP | ~24% slower than baseline |
| 20°C | 1.00 cP | Baseline |
At 5°C, particle settling velocity drops approximately 34% compared to 20°C — meaning a clarifier operating at design capacity in summer may be hydraulically overloaded in winter with no change in flow rate. Plants in cold climates should anticipate needing reduced hydraulic loading during winter months to maintain equivalent TSS removal.
A temperature differential of just 1°C between influent and tank contents can induce density currents that short-circuit flow paths and disrupt settling, compounding the viscosity effect.
Equipment Condition
Mechanical reliability governs clarifier performance in ways that hydraulic calculations don't capture. Key failure modes:
- Sludge scrapers — debris accumulation or broken shear pins from excessive sludge blanket depth stop collector mechanisms, causing uneven sludge distribution
- Weirs — damaged or misaligned effluent weirs create preferential flow paths that reduce effective detention time
- Skimmer systems — underperforming skimmers allow surface scum accumulation, which can eventually break apart and carry over into effluent
- Sludge pumps — centrifugal pumps are appropriate below 4% solids concentration; positive displacement pumps are required above 4%; using the wrong type draws water rather than concentrated sludge
How Removal Efficiency Is Measured and Validated
Efficiency is calculated as the percentage reduction in TSS or BOD₅ concentration between clarifier influent and effluent:
Efficiency (%) = [(Influent Concentration − Effluent Concentration) / Influent Concentration] × 100
Standard Analytical Methods
- TSS (Standard Methods 2540D): Sample filtered through glass-fiber filter (1.5 µm nominal pore size), dried at 103–105°C, weighed gravimetrically
- BOD₅ (Standard Methods 5210B): 5-day incubation at 20 ± 3°C in sealed bottles; dissolved oxygen measured before and after by membrane electrode or titration
BOD₅ captures only the oxygen demand exerted within the first 5 days of incubation. For industrial wastewater containing slowly degrading fibers or complex organics, this substantially underestimates total oxygen demand — the "phantom BOD" problem described above.
Composite vs. Grab Sampling
Per EPA Region 4 sampling guidance:
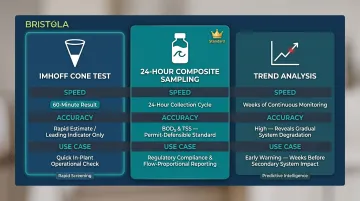
24-hour composite samples (time-weighted or flow-proportional) are the standard for BOD and TSS performance auditing because they account for temporal variability in influent characteristics. Grab samples work for rapidly changing parameters like pH, dissolved oxygen, and temperature — but they produce unreliable efficiency estimates for BOD and TSS due to flow variability. For permit reporting and performance audits, composites are the only defensible choice.
Rapid Operational Monitoring
The Imhoff cone settleable solids test (1-liter sample, 60-minute settling, volume read in mL/L) provides a rapid in-plant check on clarifier influent/effluent quality without waiting for laboratory results. The test works as a leading indicator, but it doesn't replace composite BOD₅ and TSS analysis for performance auditing.
That distinction matters for how you use the data. Trending efficiency results over time reveals far more than any single measurement — gradual degradation from sludge accumulation or hydraulic drift typically appears in trend data weeks before it becomes visible in secondary system behavior.
Consequences of Underperformance and Common Misconceptions
Downstream Cascade Effects
When primary clarifier performance degrades, every additional unit of TSS and BOD that passes through represents increased load on secondary biological treatment:
- Higher BOD increases oxygen demand on aeration systems — directly increasing energy cost
- Elevated solids loading rate on secondary clarifiers raises effluent TSS risk
- Insoluble solids carryover can destabilize activated sludge populations and create conditions favorable for filamentous bulking
- During bypass events, high solids loading can destabilize biological systems for extended periods
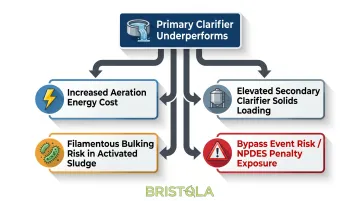
Under 40 CFR 122.41(m), bypass of any treatment unit is generally prohibited under NPDES permits. Civil penalties reach $32,500 per day per violation, with criminal prosecution authorized for knowing violations. A bypass is permissible only when all three conditions are met: it is unavoidable to prevent loss of life or severe property damage, no feasible alternatives exist, and required notifications have been submitted.
For plant managers, that means primary clarifier reliability carries direct permit compliance consequences — not just operational ones.
Two Misconceptions Worth Correcting
Published efficiency ranges are benchmarks, not guarantees. They assume specific operating conditions. When those conditions aren't met — industrial influent, hydraulic overload, cold temperatures, accumulated sludge — actual performance can fall well below published ranges without any equipment failure.
High settleable solids removal does not confirm satisfactory TSS and BOD performance. Operators who track only settleable solids can miss declining fine particle and soluble BOD removal until secondary systems show visible stress. All three metrics — settleable solids, TSS, and BOD — should be trended independently.
The Interdependence of Primary and Secondary Performance
Primary and secondary treatment are operationally coupled. When primary performance slips, secondary systems absorb the difference — higher biological load, increased sludge production, and greater toxicity risk when industrial streams carry compounds that secondary biology cannot handle at elevated concentrations. Decisions made about one stage affect outcomes at the other.
Frequently Asked Questions
What is the efficiency of BOD removal during primary treatment?
Primary clarifiers typically remove 25–40% of total BOD₅ under standard operating conditions, with chemical enhancement (CEPT) pushing this to 40–60%. Soluble BOD sets that ceiling — dissolved organics cannot be separated by gravity settling, no matter how well the clarifier performs.
How much of the total suspended solids can primary treatment remove from wastewater?
Primary clarifiers typically remove 50–65% of TSS under standard conditions. The gap between that figure and the 95–99% settleable solids removal reflects non-settleable fine particles that require chemical enhancement, lamella plates, or longer detention time to capture.
What is the difference between settleable solids and total suspended solids removal in a primary clarifier?
Settleable solids are the denser particles that sink by gravity within the clarifier's retention time. TSS includes both settleable and non-settleable fine particles — which is why TSS removal (50–65%) is always lower than settleable solids removal (95–99%).
Why does primary treatment remove less BOD than suspended solids?
A portion of BOD in wastewater is dissolved (soluble), meaning it cannot be physically separated by settling. That's why BOD removal tops out at 25–40% — only the particulate BOD fraction that travels with settleable solids can be captured.
What factors cause primary clarifier efficiency to fall below the expected range?
The main causes include:
- Hydraulic overload reducing detention time
- Sludge blanket buildup compressing effective tank volume
- High non-settleable fine particle content in industrial influents
- Cold temperatures slowing settling velocity
- Equipment malfunctions in sludge removal or skimming systems
How does sludge accumulation in a primary clarifier affect removal efficiency over time?
Accumulated sludge shrinks effective clarifier volume and shortens detention time, pushing the sludge blanket toward the effluent zone and increasing solids carryover. WEF identifies 1–3 feet as the ideal blanket depth — beyond that, TSS and BOD removal both decline until the material is removed.